MAIN
FOCUS is a complete workflow for processing NMR metabolomics data that provides efficient methodological advances both on peak alignment and metabolite identification.
FOCUS has been developed at the Grup de Recerca de Reumatologia (GRR) which is a biomedical research group from the Vall d'Hebron Hospital Research Institute (Barcelona, Spain) in collaboration with the Metabolomics Platform which is a research and facility center from the Universitat Rovira i Virgili (Tarragona, Spain) and CIBERDEM.
Main workflow steps:
- Spectral alignment: FOCUS is based in RUNA (Recursive UNreferenced Alignment) algorithm, which represents an improvement over previous methodologies by avoiding the use of a reference spectrum.
- Peak detection and quantification: FOCUS applies a novel peak picking approach based on the computation of a consensus peak signal which estimates at each spectral point the frequency of samples having a peak region spanning the considered point. This algorithm shows a very good behavior even on noisy and highly unaligned data since it is able to correctly delimitate peak regions that still present slight chemical shifts across the samples after having applied alignment algorithms.
- Metabolite identification: FOCUS provides two procedures that accelerate this common and time-consuming task. First, it allows an exhaustive exploration of the correlation patterns of peaks of interest that can lead to metabolite identification by querying metabolomic databases. Second, the user can define a set of metabolite reference spectra and match them to the set of spectra peaks, giving an informative probabilistic identification score that does not rely on grouping correlation thresholds.
This work was supported by the by the Spanish Ministry of Economy and Competitiveness:

FOCUS PACKAGE
FOCUS matlab package can be freely downloaded from this link (please, read the license file provided within the package).
As an input, the code use a data file format that can be easily generated. The following inputs are required:
- A filename of the file containing the intensity data (tab-separated columns) where samples are placed column-wise and spectral points row-wise. An example of intensity data file ("demo_int.txt") is provided in the demo.
- A filename of the file containing the ppm coordinates (column-wise). An example of ppm data file ("demo_ppm.txt") is provided in the demo.
- A filename of the file containing the sample names (column-wise). An example of sample data file ("data_samples.txt") is provided in the demo.
-
A set of input parameters that adjust FOCUS analysis. A default set of parameters can be generated using focus_parameters() function. Between all the required parameters the most important ones are:
id Analysis identification name (a folder using this name will be created to store all the generated results) window.fs Downsampling frequency (default=1) window.length Analysis window length (default=0.0769ppm) peak.DFL Derivative filter length for peak detection (default=0.001ppm) peak.pT Minimum peak increment to consider a peak peak.pS Peak sample frequency within a spectral region to consider a peak on the dataset (default=0.10)
DOWNLOADS
| FOCUS MATLAB PACKAGE AND DEMO | Download |
|---|---|
| PYTHON REPORT GENERATION TOOL | Download |
- FOCUS MATLAB PACKAGE has been developed using Matlab R2009b.
- Please, when running the demo review the relative path of the FOCUS package folder with respect to the demo folder and update the matlabpath arguments if necessary.
- Python report generation tool consists of a Python script. In order to run it, please check that Python is installed on your computer (Python installation web).
RESULTS REPORT EXAMPLE
We provide an example of a results report generated by FOCUS after processing 120 1H-NMR spectra corresponding to liver extracts.
| RESULTS REPORT EXAMPLE |
|---|
DEMO
This demo is automatically downloaded with the FOCUS Matlab package.
BEFORE STARTING FOCUS ANALYSIS...
Add FOCUS source to matlab path:
matlabpath([pathdef, '../focus;', '../export_fig;', '../identification']);
- '../focus;' contains the functions related to spectral alignment, peak detection and peak quantification.
- '../identification;' contains the functions related to metabolite identification.
- '../export_fig;' is a third-party package provided with its own license that provides functions for high quality image generation.
SPECTRAL ALIGNMENT, PEAK DETECTION AND PEAK QUANTIFICATION
Generate default parameters:
parameters = focus_parameters;
Adapt the default parameters to the dataset:
parameters.id = 'urine_demo'; % dataset identifier
parameters.peak.pT = [2 1e-3]; % minimum intensity increment to consider a peak
FOCUS analysis:
results = focus_workflow('demo_int.txt','demo_ppm.txt','demo_samples.txt',parameters,[]);
- 'demo_int.txt' Intensities files.
- 'demo_ppm.txt' Spectral points (ppms) file.
- 'demo_samples.txt' Sample names file.
- parameters Input parameters structure previously defined.
- [] Automatic analysis of the whole spectra.
Results overview:
- A folder named as parameter.id is created on the working directory containing the analysis results.
- The function output results is saved in the results folder (results.mat)
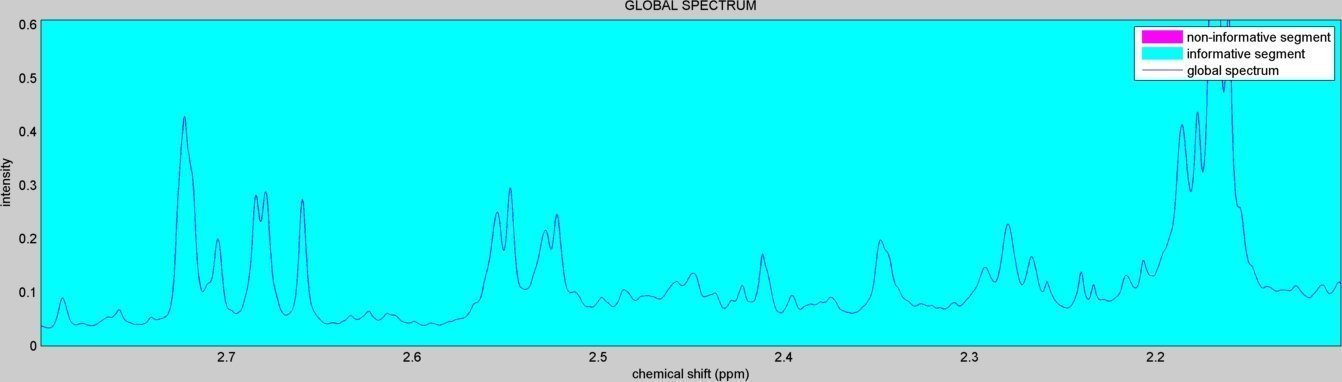
- A figure showing the detected spectral informative regions is created ("informative_spectral_segments.jpg"):
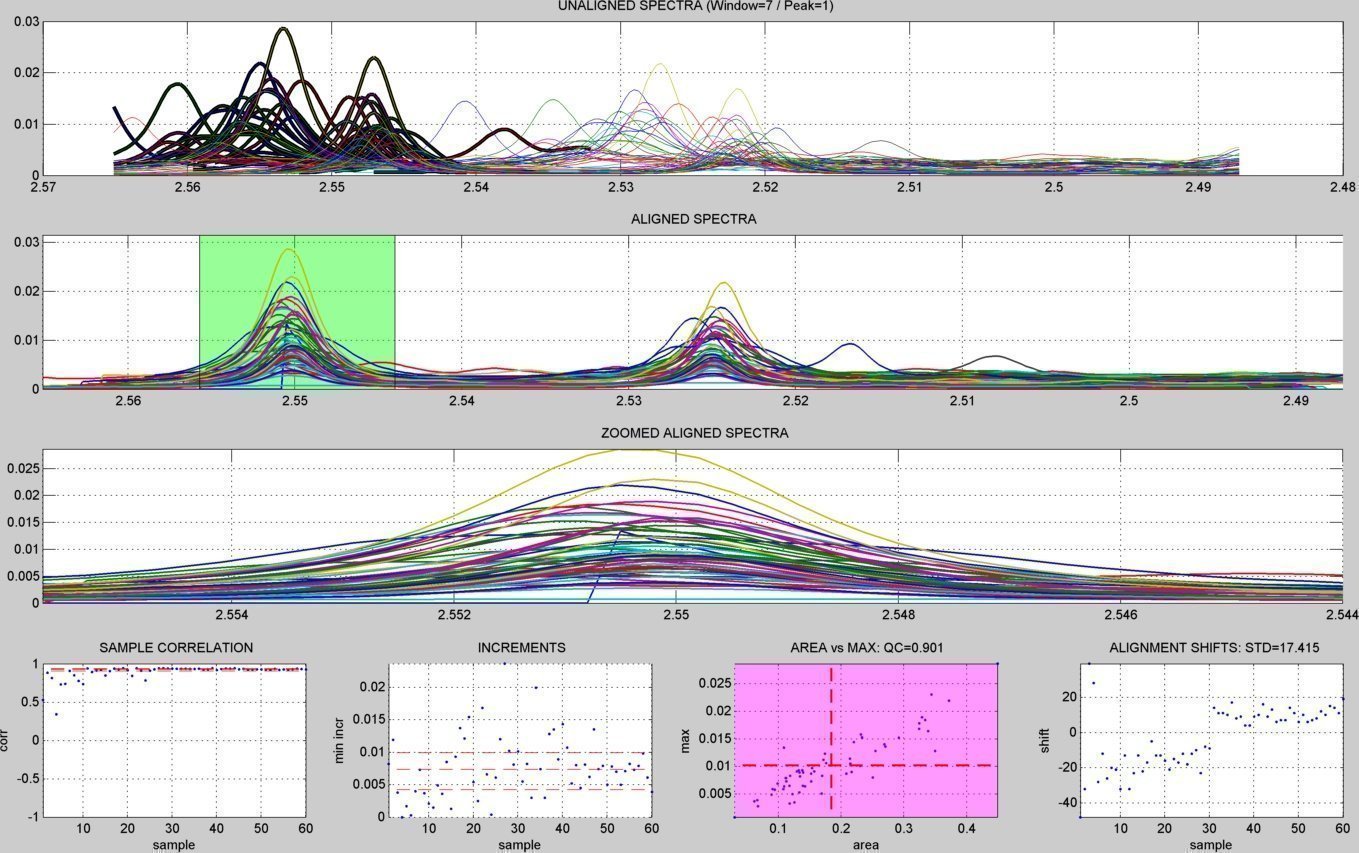
- A subdirectory "figures/" is created to save the figures related to each spectral window analyzed ("alignment_XX.jpg" & "peak_window_XX.jpg") and to each detected peak ("peak_XX.jpg"). The figures below show an example window within the citrate peaks region:
alignment summary figure 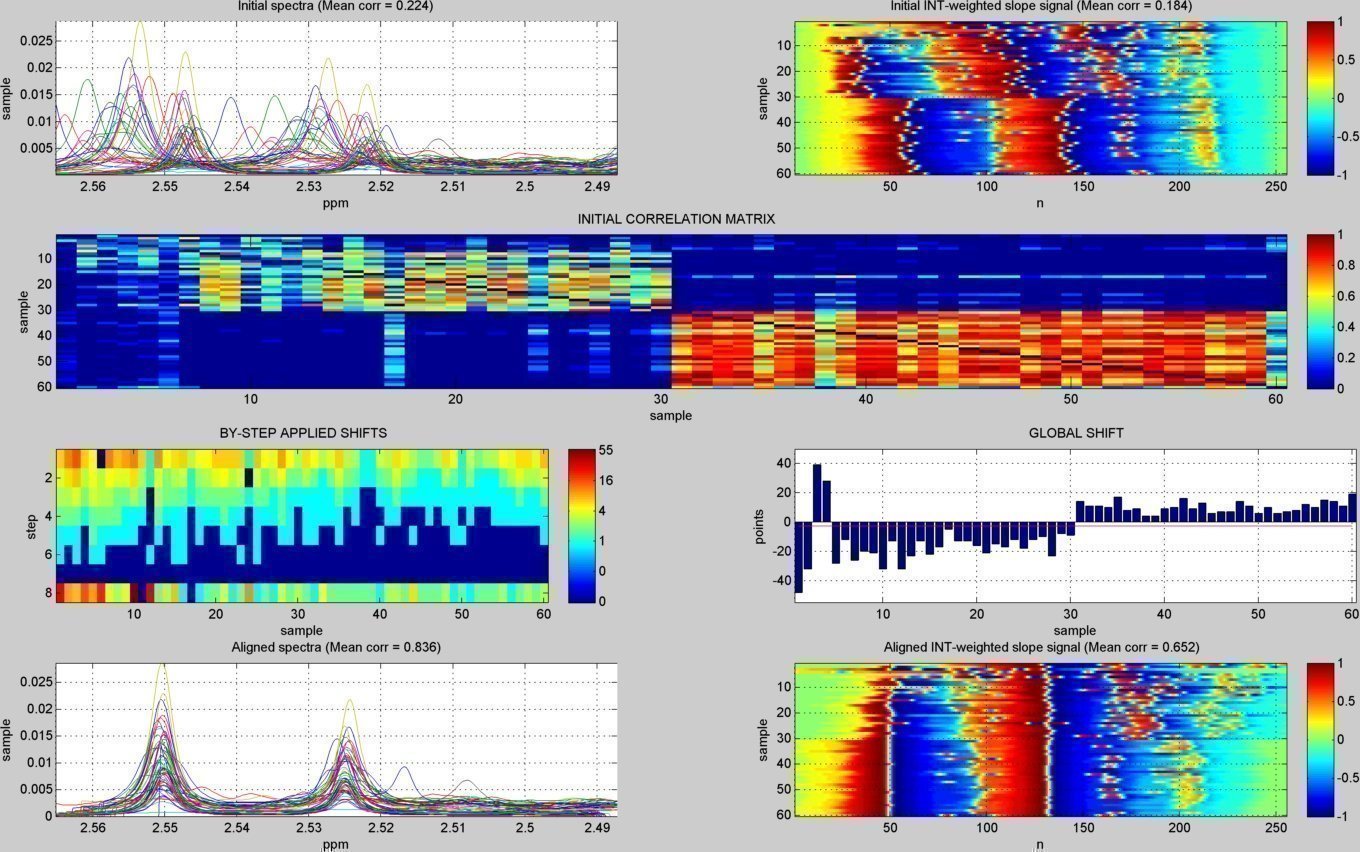
window peak detection summary figure 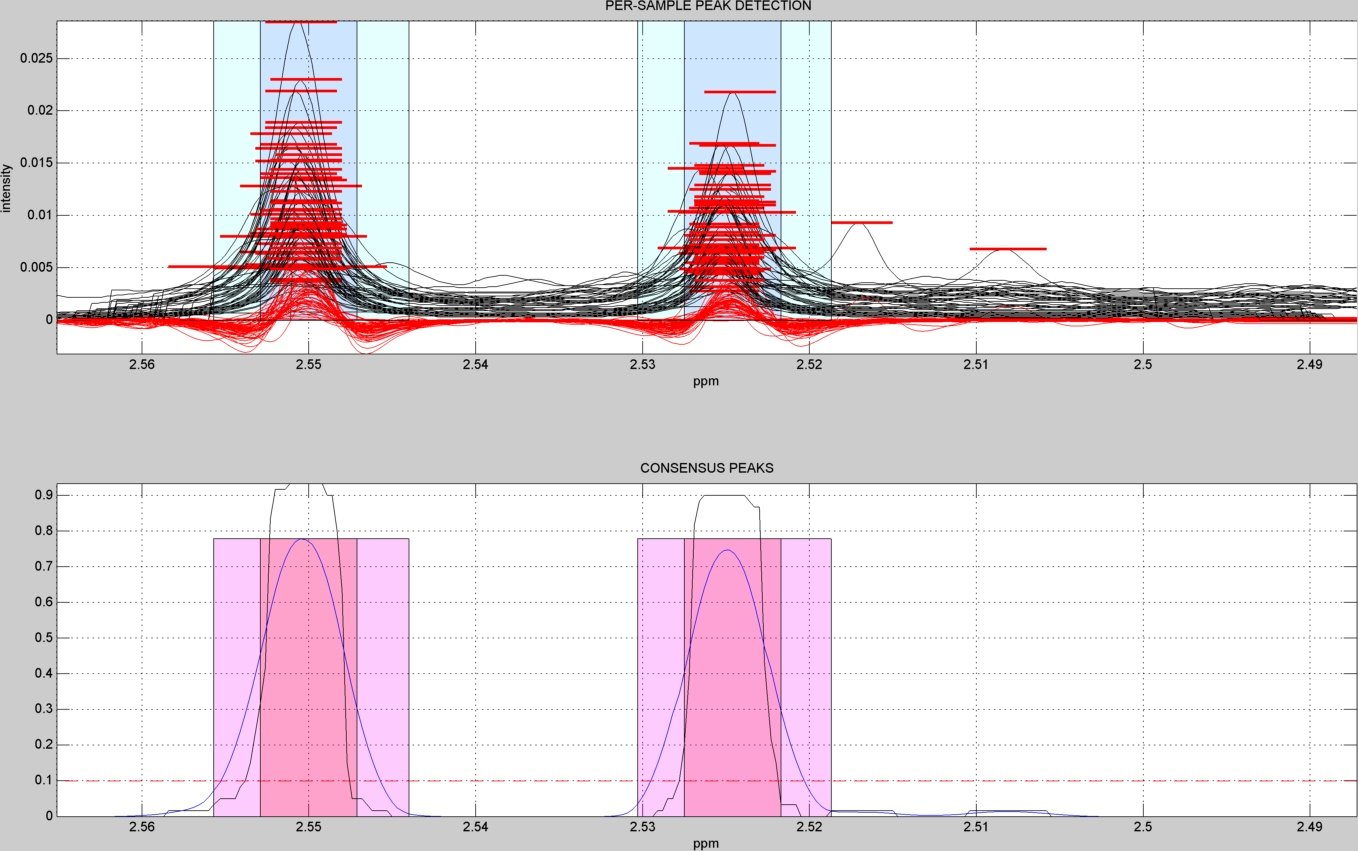
peaks summary figures 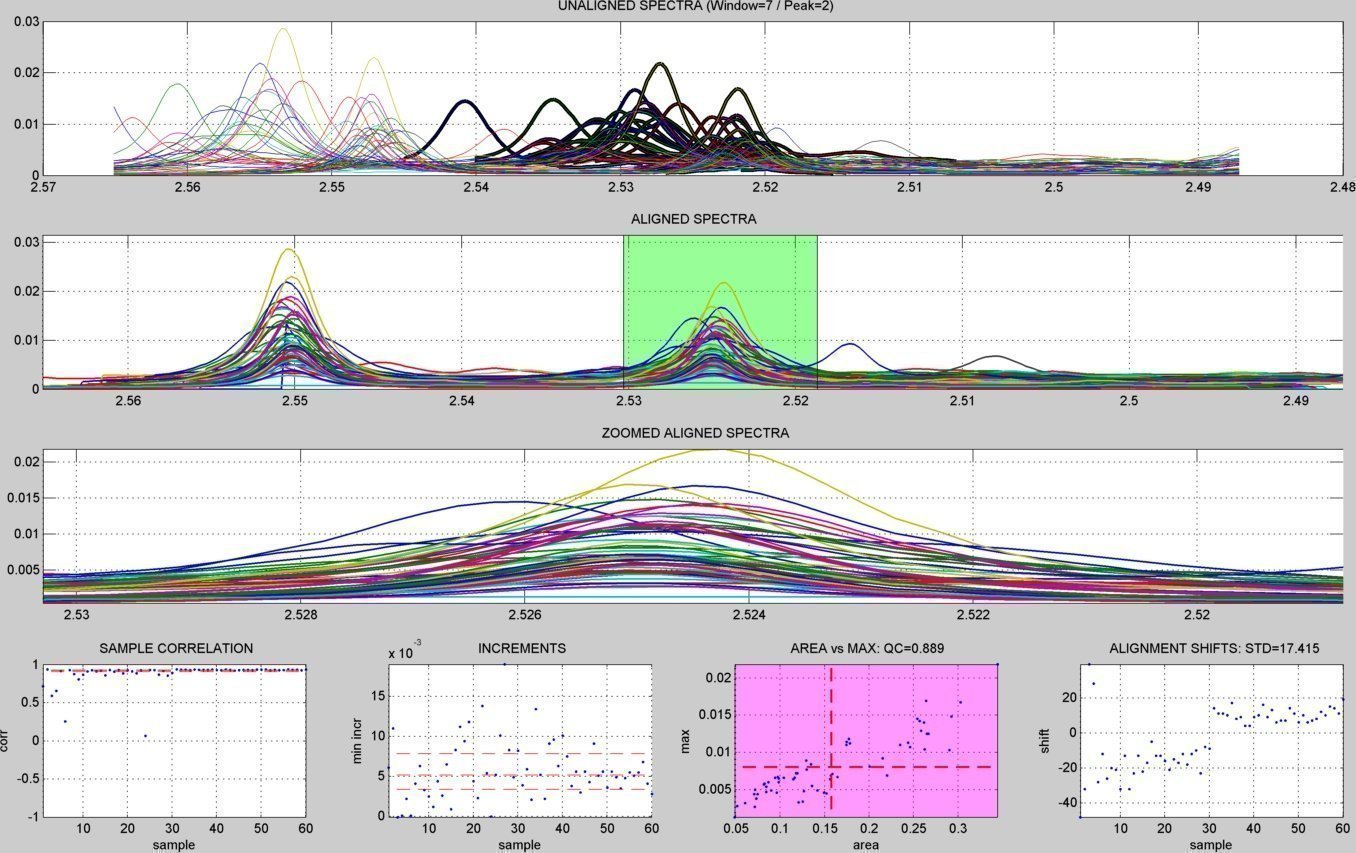
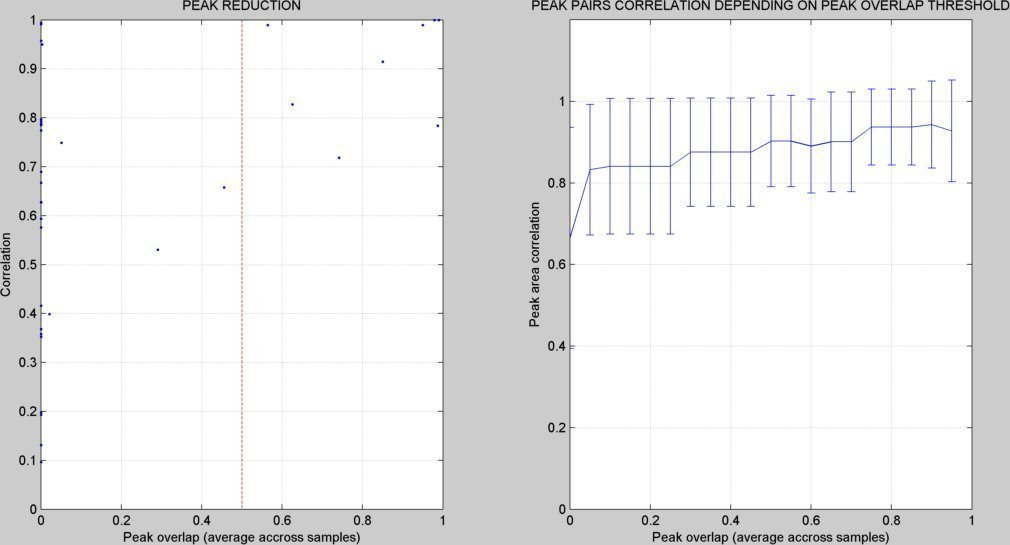
- A figure showing the peak reduction results is created ("peak_reduction.tif"):
EXPORTING PEAK DATA (PEAK INFORMATION AND INTENSITIES)
To export peak data information and intensities use:
data = export_peaks(results,1,1);
This command will create the followind files on the dataset results folder:
- A file named peak_data.txt with general information about each detected peak.
- A file named intensity_data.txt with sample intensities of each detected peak.
- A folder named peak_data with information details of each peak (it will be used for the results report generation script).
METABOLITE IDENTIFICATION
Load reference metabolite spectra into an structure variable (S in this demo) with all the reference spectra. In this demo we will include one metabolite ("citrate"):
S{1}.name = 'citrate-7.0';
S{1}.spect=[[2.674 75853720];[2.649 110800152];[2.550 113938640];[2.525 77852232]];
Metabolite identification analysis:
data = peak_identification(results,S,0.05,0.03,0.005,[0.85 0.85],1);
- results Output from focus_workflow() function.
- S Reference metabolite spectra.
- d_cluster (0.05) Minimum ppm-distance between peaks to apply cluster splitting.
- t_cluster (0.03) Cluster search interval expansion.
- t_peak (0.005) Intra-cluster peak ppm tolerance.
- t_corr (0.85,0.85) Minimum correlation for matching peaks and for penalization peaks.
- fig (1) Figure handle for plotting peaks.
Results overview:
- A folder is created on the analysis results directory containing the identification results ("peak_identification").
- A file with the details of each peak identification is created ("(results directory)/peak_identification/(peak_id).txt").
- For each dataset peak, a figure showing the each identification result is created:
citrate results 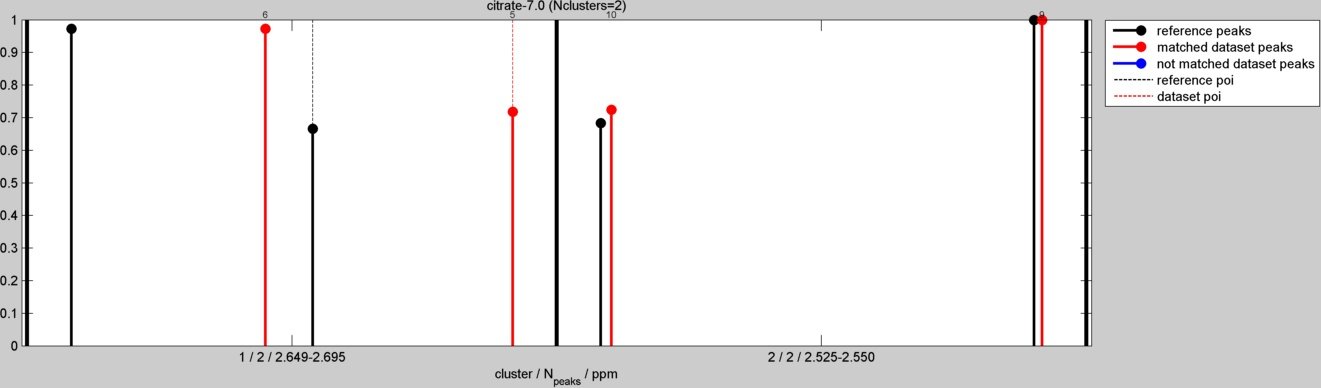
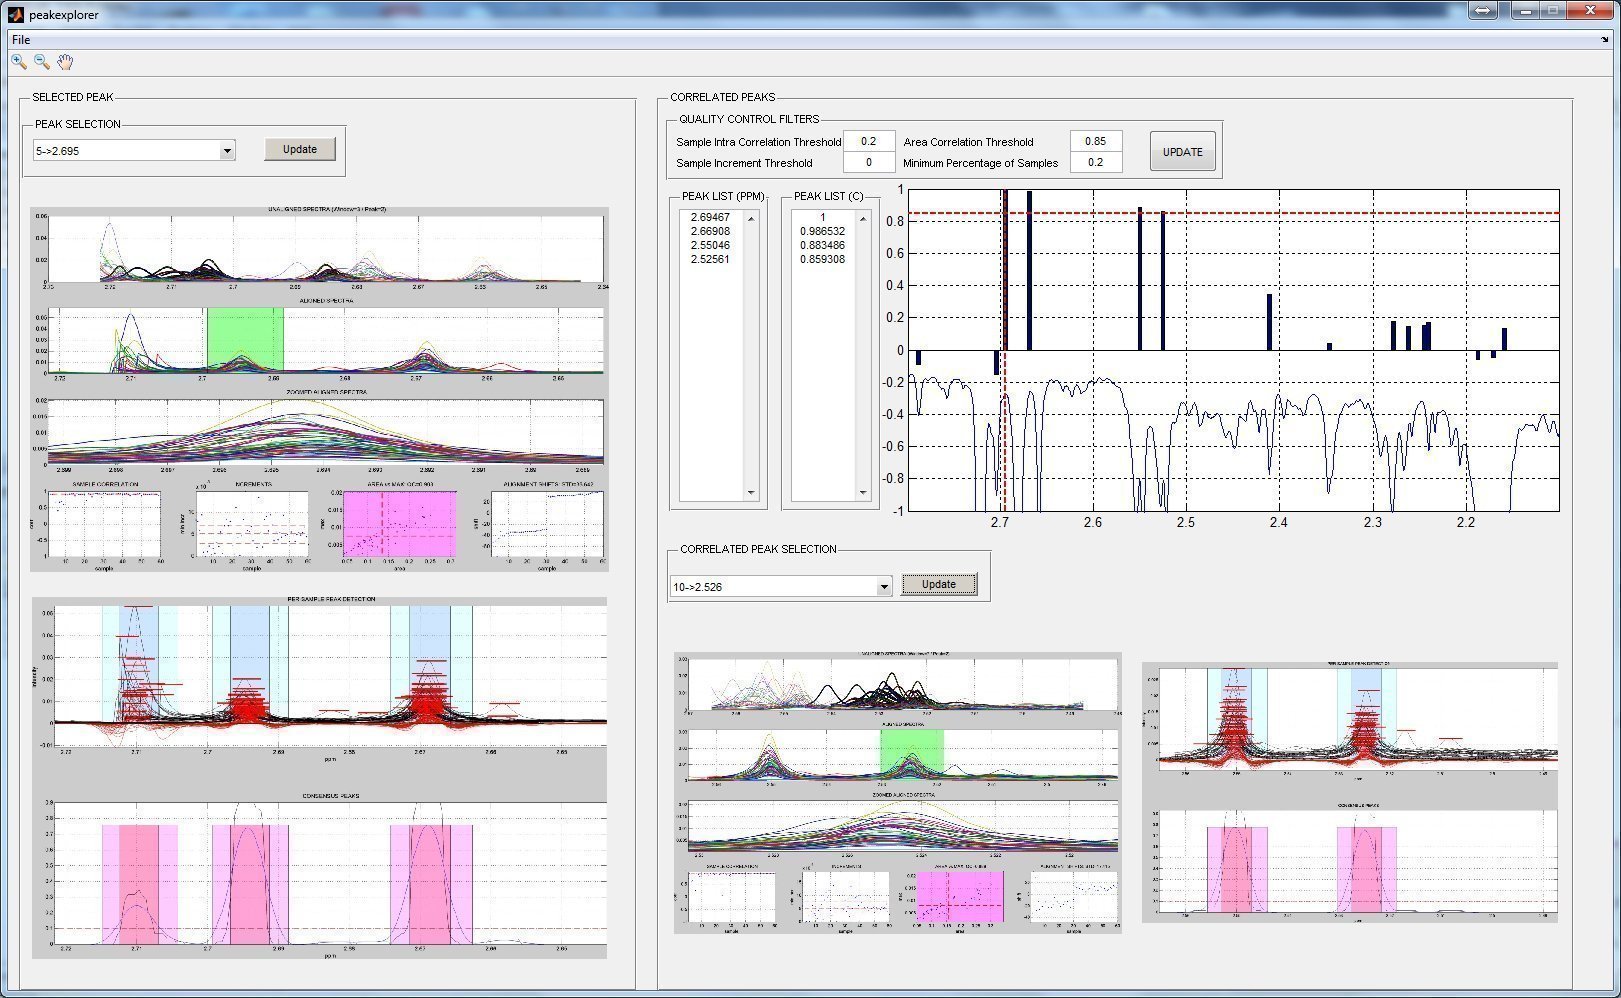
PEAK EXPLORER
A graphical user interface has been created in order to allow an easy exploration of the correlation patters of each peak. In order to work, a matlab variable "results" must be presend in the workspace containing the ouput of the focus_workflow() function.
peakexplorer;
RESULTS REPORT GENERATION
Once the dataset of interest has been processed by applying:
- focus_workflow()
- export_peaks()
- peak_identification()


VERSION LOG
| Version 1.0 | 10/2013 | First public version of FOCUS |
|---|---|---|
| Version 1.1 | 12/2013 | Added functionality for user-defined spectral segments of analysis. |
| 12/2013 | Annotated feature matrix after identification. |